> ## Documentation Index
> Fetch the complete documentation index at: https://docs.spectate.net/llms.txt
> Use this file to discover all available pages before exploring further.
# Dashboard
A monitor's dashboard provides a quick overview of the monitor's status and performance. The dashboard is available from the monitor list. Click the monitor name to open the dashboard.
The dashboard displays the following information:
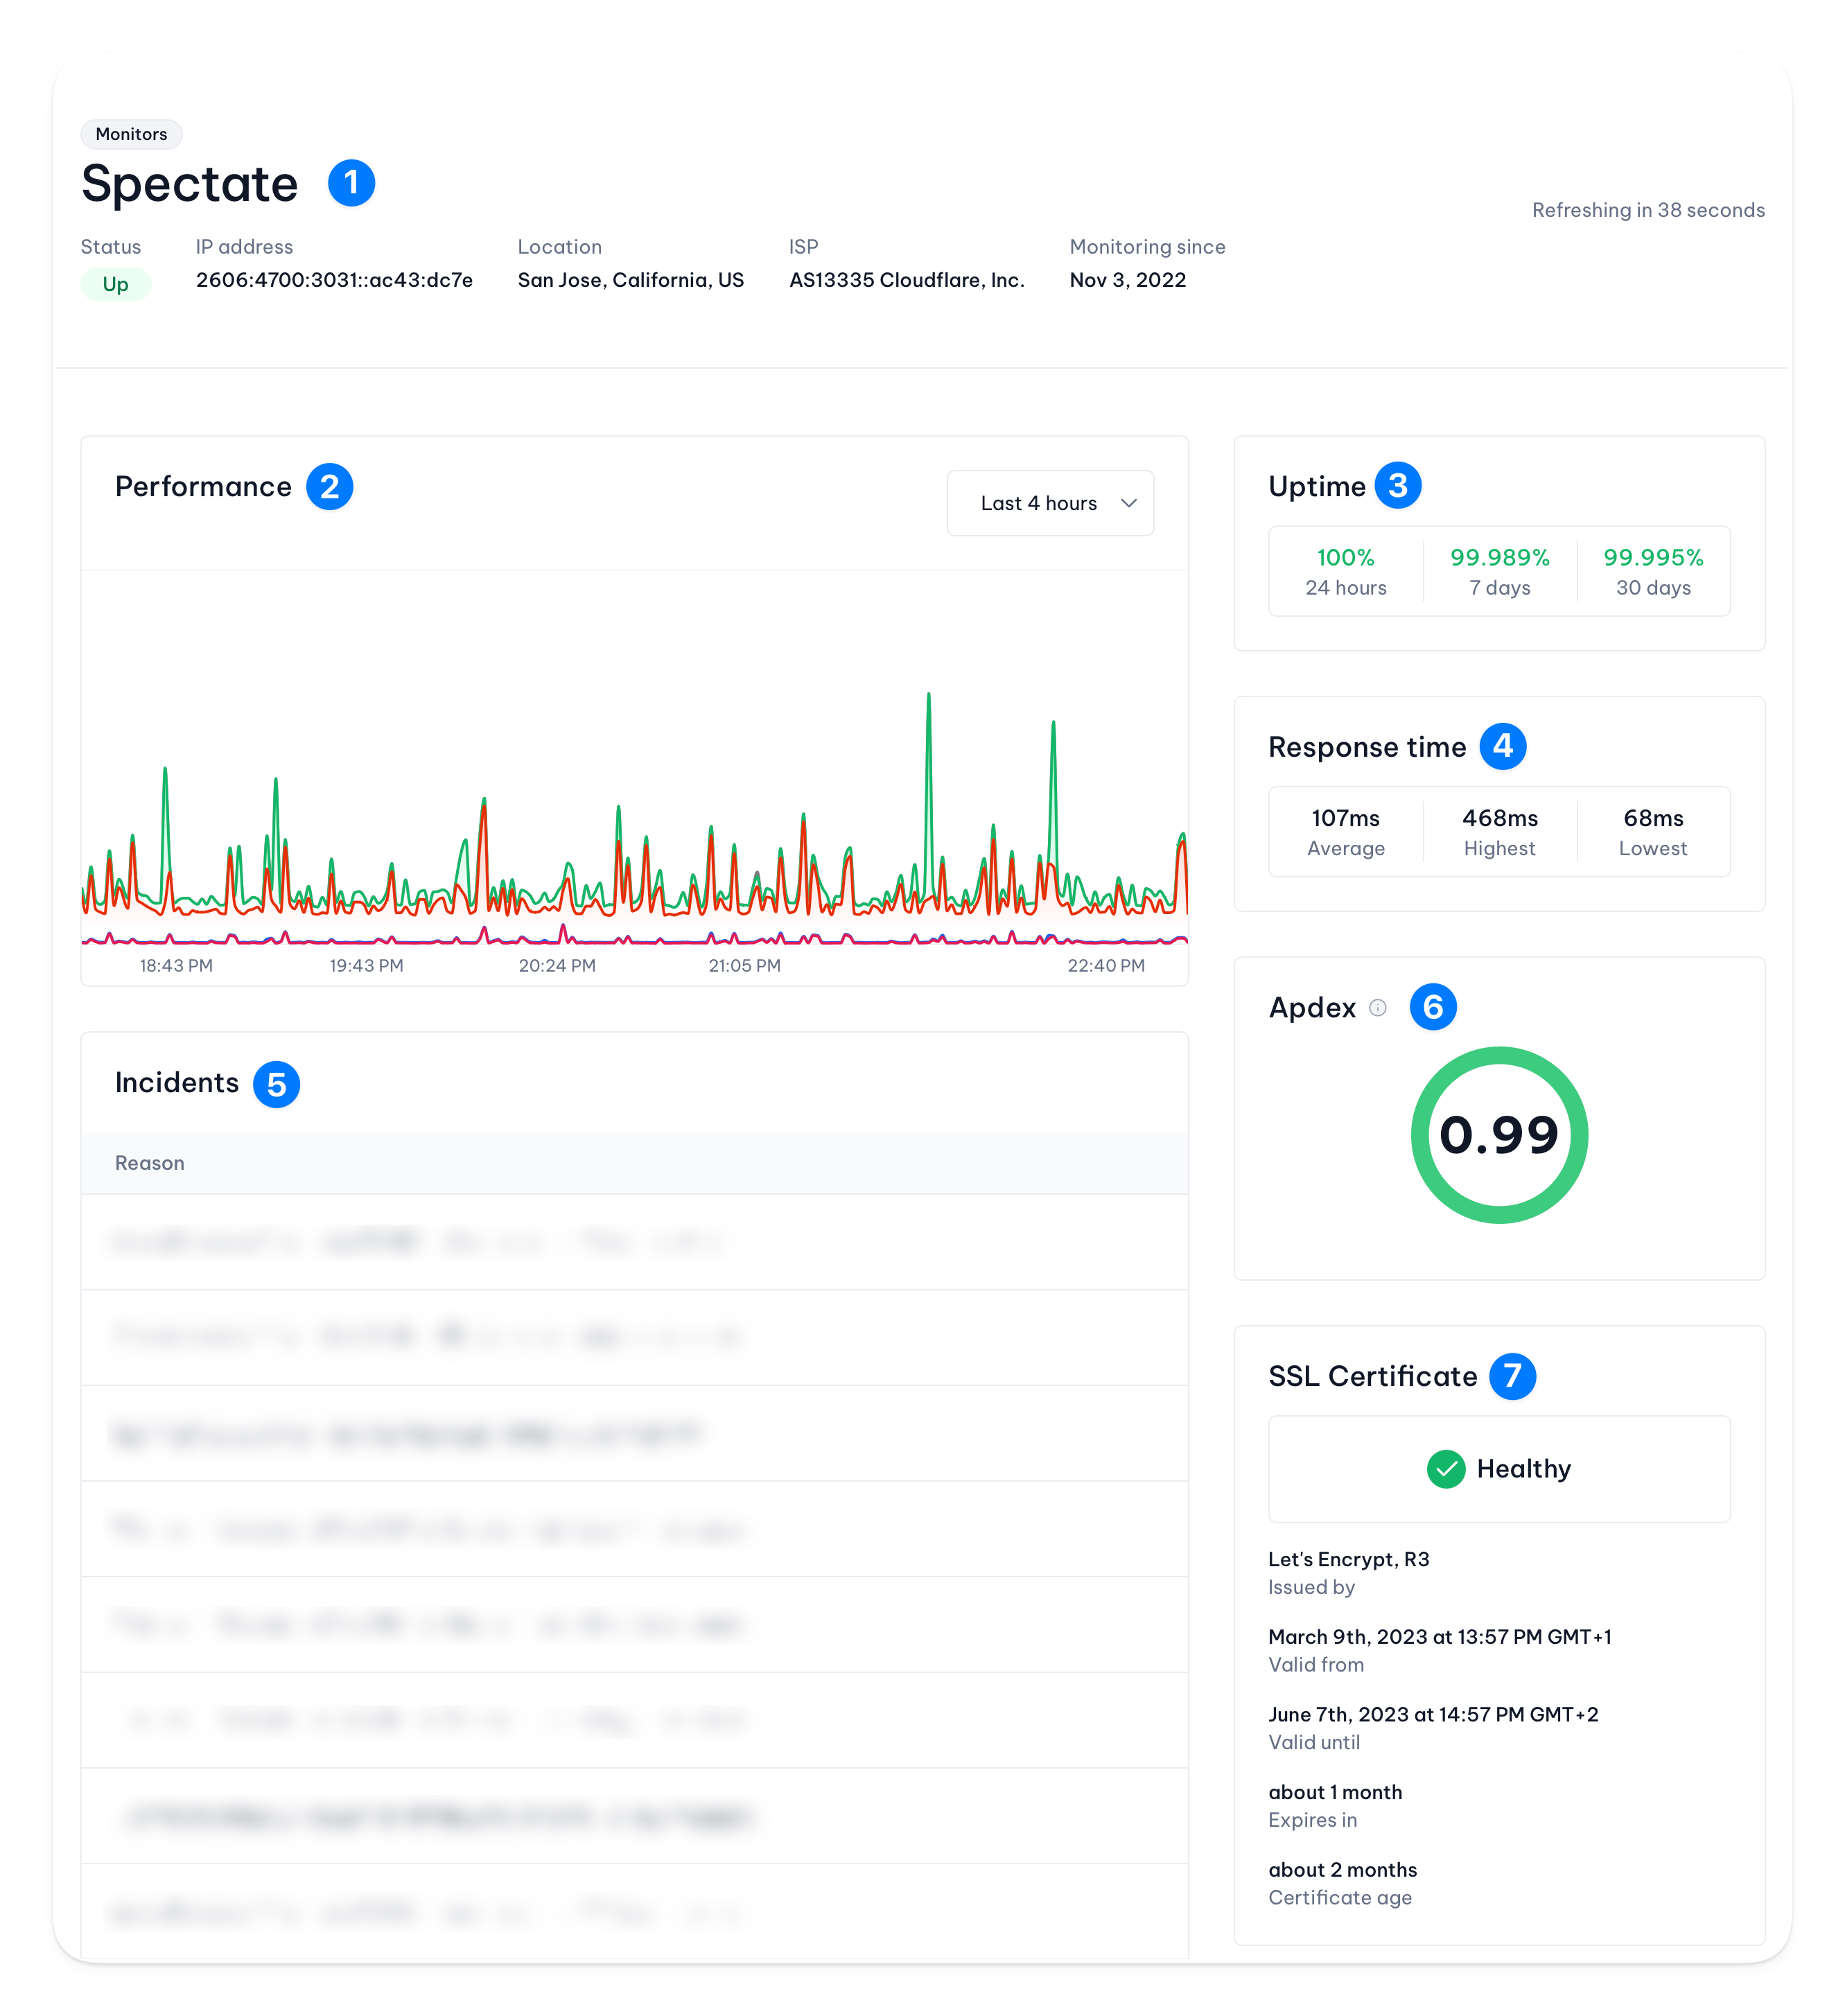 ### 1. Monitor details
This section displays the monitor's name, type, and status. The status is either **OK** or **Down**. It also gives you insights into the IP address, location, and ISP.
### 2. Performance
This chart shows the monitor's performance over the last 4 hours. You can hover over the chart to see the exact values.
Depending on the protocol of the monitor, the chart shows different metrics:
* **ICMP**: response time
* **HTTP**: DNS lookup time, connection time, time to first byte, and total response time
* **HTTPS**: DNS lookup time, connection time, SSL handshake time, time to first byte, and total response time
You can change the timeframe of the chart by clicking the **4 hours** button and selecting a different timeframe, up to 30 days.
### 3. Uptime
This section shows the monitor's uptime over the last 24 hours, 7 days and 30 days. The uptime is calculated as the percentage of time the monitor was up over a given period.
### 4. Response time
This section shows the monitor's average, highest and lowest response time over the selected timeframe.
### 5. Incidents
This section shows all incidents related to the monitor. It gives you easy access to the incident details and allows you to acknowledge or resolve the incident.
### 6. Apdex
This section shows the monitor's Apdex score over the selected timeframe. The Apdex score is calculated as the percentage of requests that were satisfied, tolerated, or frustrated.
### 7. SSL certificate
import { Callout } from "nextra-theme-docs";
SSL certificate information is only available for HTTPS monitors.
This section shows the SSL certificate information for the monitor. It displays the certificate's issuer, validity, and expiration date.
### 1. Monitor details
This section displays the monitor's name, type, and status. The status is either **OK** or **Down**. It also gives you insights into the IP address, location, and ISP.
### 2. Performance
This chart shows the monitor's performance over the last 4 hours. You can hover over the chart to see the exact values.
Depending on the protocol of the monitor, the chart shows different metrics:
* **ICMP**: response time
* **HTTP**: DNS lookup time, connection time, time to first byte, and total response time
* **HTTPS**: DNS lookup time, connection time, SSL handshake time, time to first byte, and total response time
You can change the timeframe of the chart by clicking the **4 hours** button and selecting a different timeframe, up to 30 days.
### 3. Uptime
This section shows the monitor's uptime over the last 24 hours, 7 days and 30 days. The uptime is calculated as the percentage of time the monitor was up over a given period.
### 4. Response time
This section shows the monitor's average, highest and lowest response time over the selected timeframe.
### 5. Incidents
This section shows all incidents related to the monitor. It gives you easy access to the incident details and allows you to acknowledge or resolve the incident.
### 6. Apdex
This section shows the monitor's Apdex score over the selected timeframe. The Apdex score is calculated as the percentage of requests that were satisfied, tolerated, or frustrated.
### 7. SSL certificate
import { Callout } from "nextra-theme-docs";
SSL certificate information is only available for HTTPS monitors.
This section shows the SSL certificate information for the monitor. It displays the certificate's issuer, validity, and expiration date.