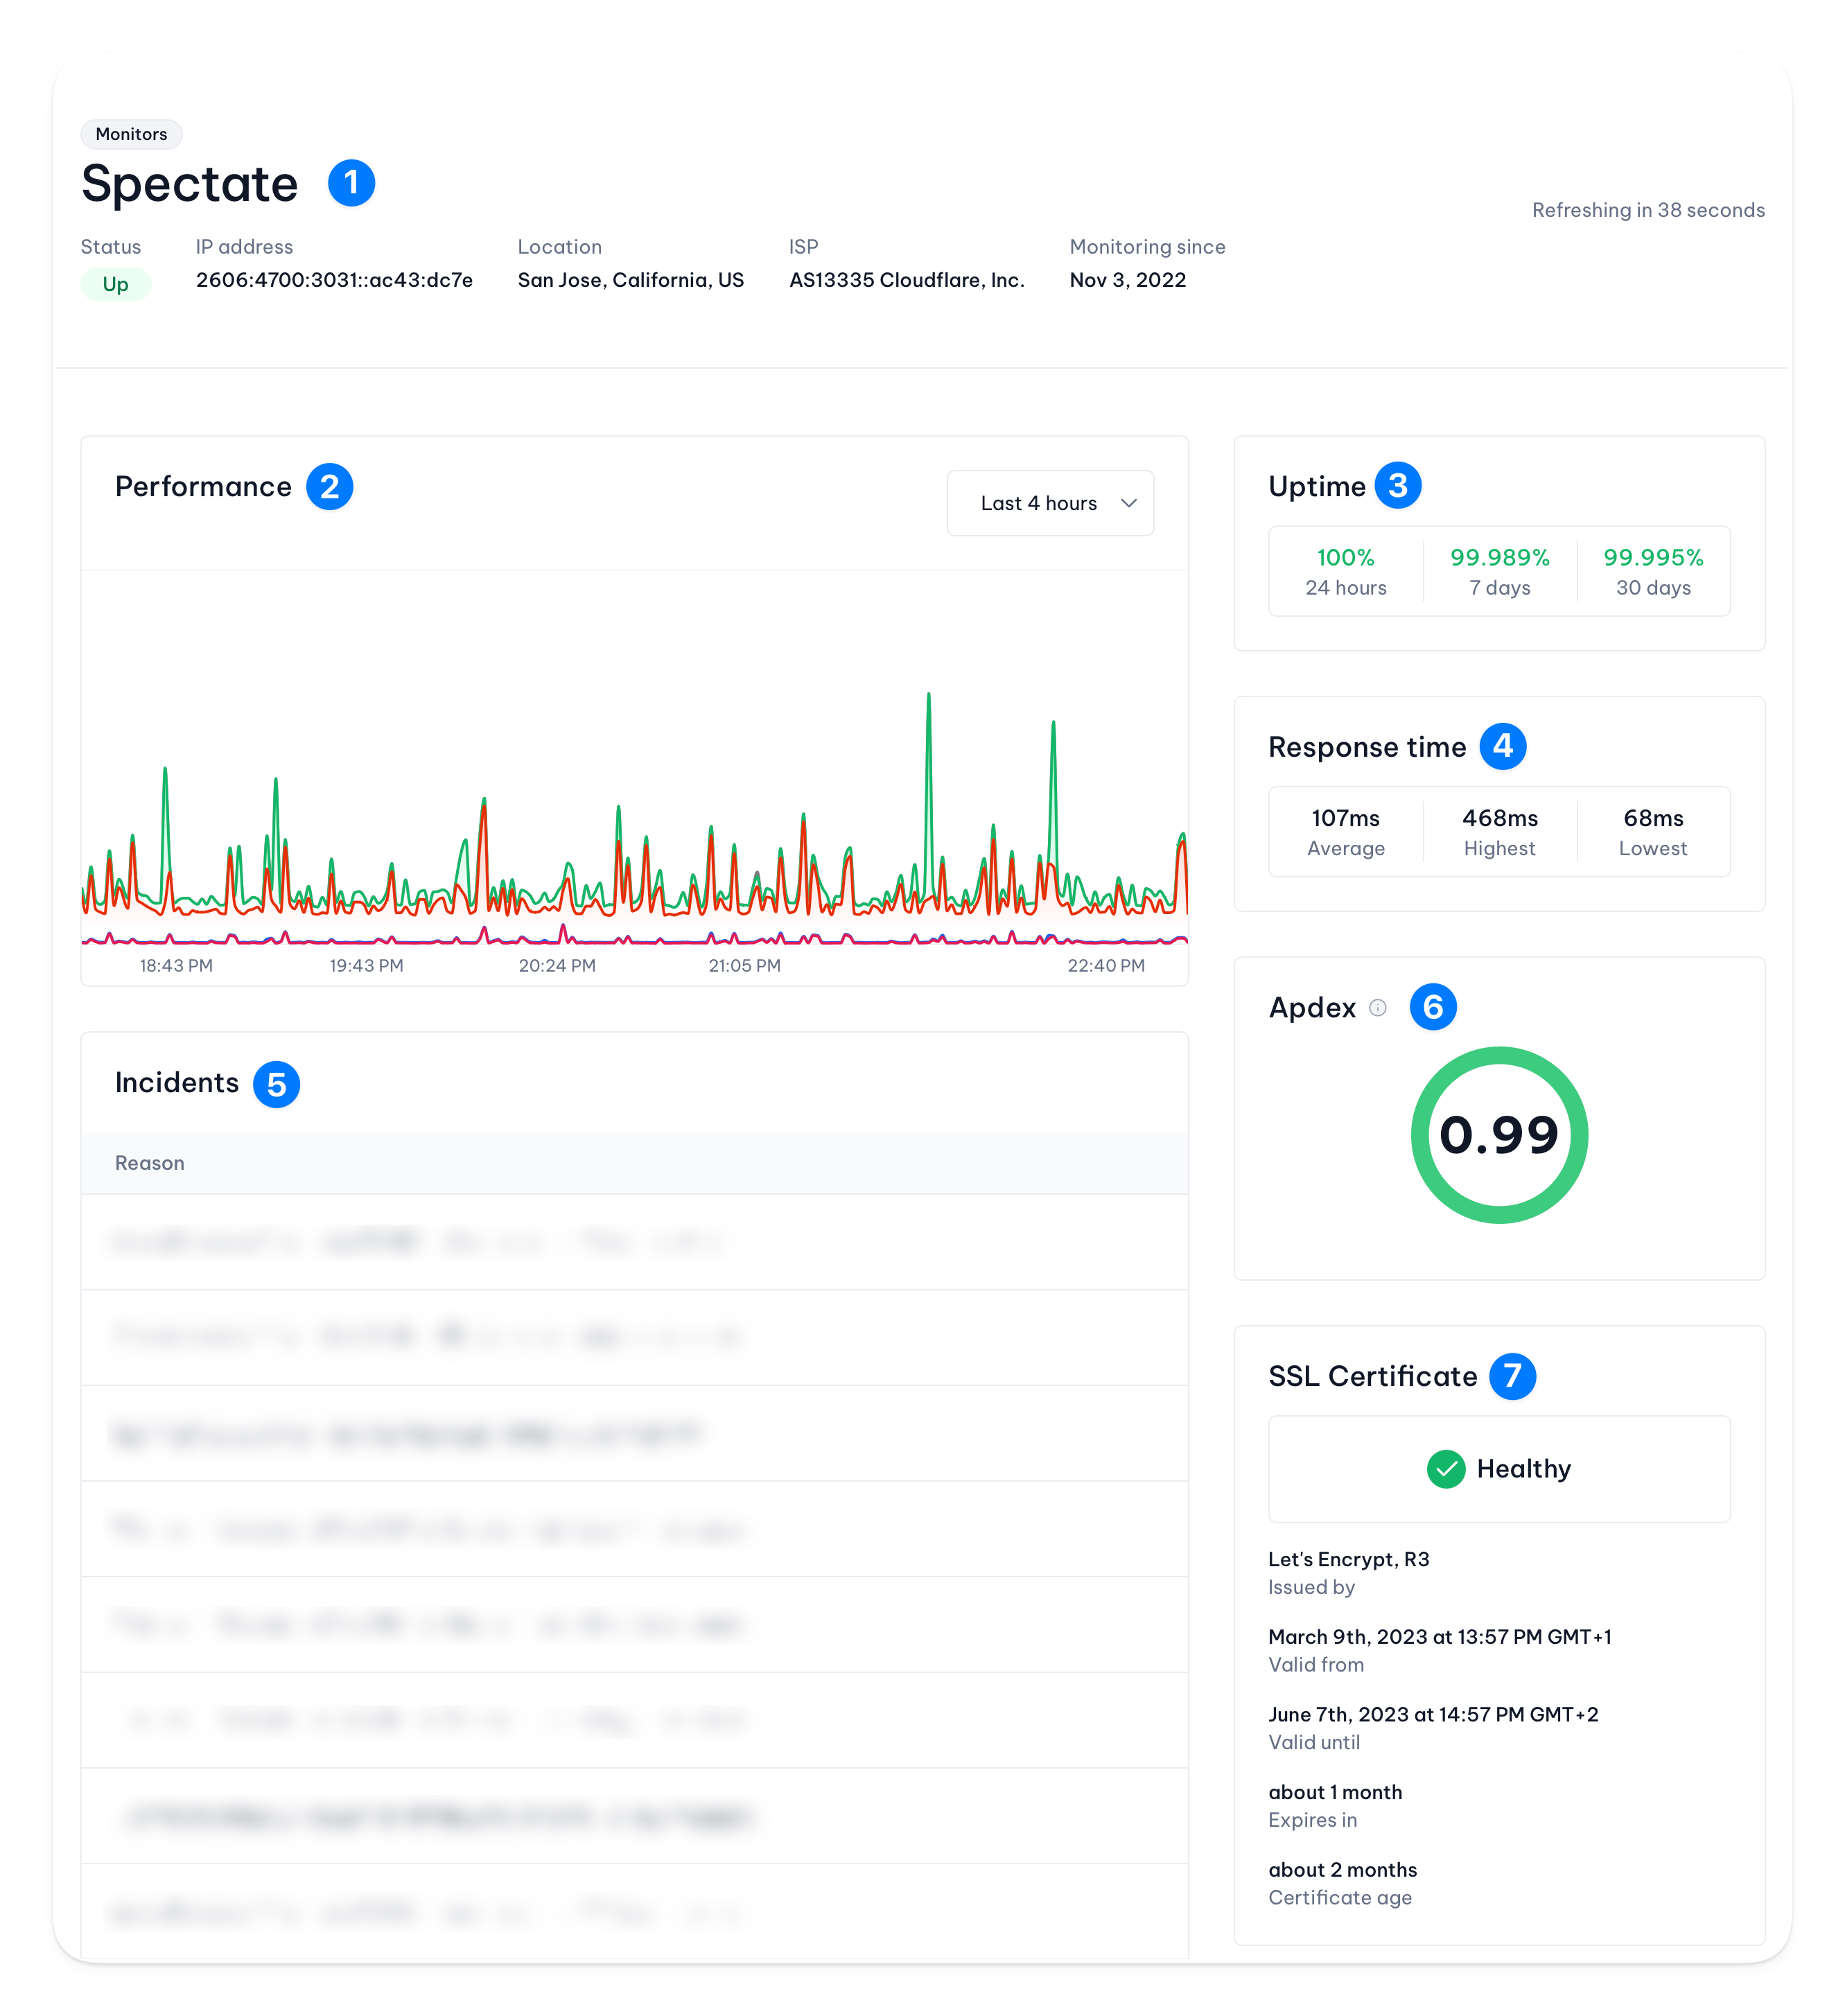
1. Monitor details
This section displays the monitor’s name, type, and status. The status is either OK or Down. It also gives you insights into the IP address, location, and ISP.2. Performance
This chart shows the monitor’s performance over the last 4 hours. You can hover over the chart to see the exact values. Depending on the protocol of the monitor, the chart shows different metrics:- ICMP: response time
- HTTP: DNS lookup time, connection time, time to first byte, and total response time
- HTTPS: DNS lookup time, connection time, SSL handshake time, time to first byte, and total response time
3. Uptime
This section shows the monitor’s uptime over the last 24 hours, 7 days and 30 days. The uptime is calculated as the percentage of time the monitor was up over a given period.4. Response time
This section shows the monitor’s average, highest and lowest response time over the selected timeframe.5. Incidents
This section shows all incidents related to the monitor. It gives you easy access to the incident details and allows you to acknowledge or resolve the incident.6. Apdex
This section shows the monitor’s Apdex score over the selected timeframe. The Apdex score is calculated as the percentage of requests that were satisfied, tolerated, or frustrated.7. SSL certificate
SSL certificate information is only available for HTTPS monitors.